Hi
I wanted to share with you some of my experience about automating the process of deploying Grafana and custom dashboards
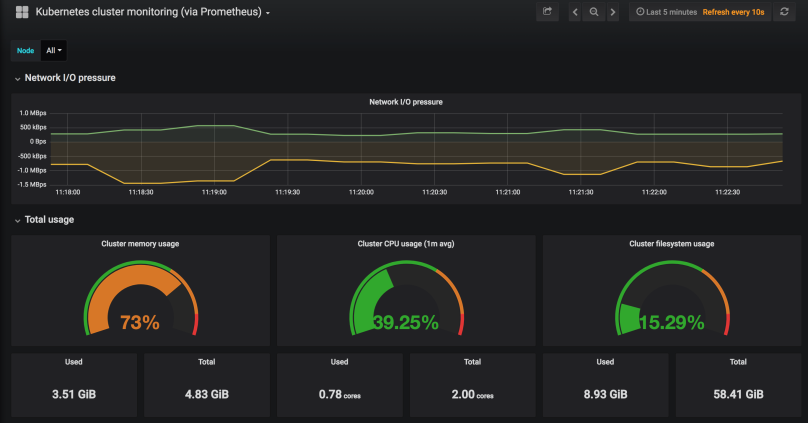
In this process, I used the Prometheus operator to collect time-series metrics from my Kubernetes cluster and added Grafana to visualize it all in a beautiful way
If you want to know more about the process, or if you’re new to the micro-services world, you’re welcome to read the full post here where I discuss each component in detail and illustrate the provisioning process
Best,
Omer Barel
DevOps Consultant, CodeValue